The investing strategy hinges on three related models an annual return model for deciding whether or not to leverage the strategy and daily and weekly models to decide whether to be long the S&P500 (bull), short the S&P500 (bear), or to sit out (duck).
Regarding the annual model, I use a threshold of +/- .08 for my leveraging decision. Thus, ln(AnnualGrowthFactor) > .08 calls for positive leverage. The annual model’s standard error is .0865. Essentially, I have to believe that the market is fundamentally over or undervalued to use leverage.
Regarding the daily and weekly models, I use a threshold of +/-.02. Thus, both the daily model have to have a logged daily and weekly growth factor of more than .002 for me to invest. When the models contradict each other or are between -.002 and .002, I just patiently sit out. Here the standard errors are much larger relative to the investment threshold at .0095 for the daily model and .0204 for the weekly model. That said, investing can still work as in aggregate exposing myself to those markets pays off despite not all clearly being wins.
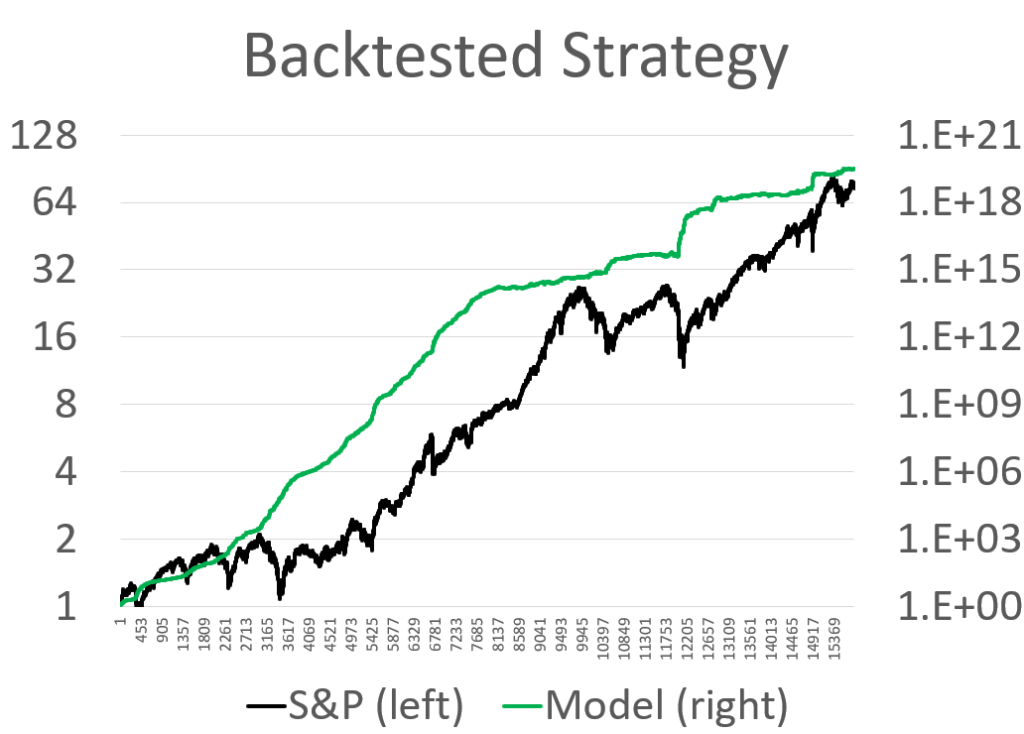
The backtesting for this approach over the past 60+ years is clearly not replicable in practice, but I’d be happy to get a fraction of the backtesting results.

Recent decades have seen a slow down in pace, but still steady returns that outpace just HODL by a factor of ~500. Also, it’s a much more steady trip up.
Regarding limitations, growing a $1 investment into trillions or more is admittedly ludicrous. The strategy will break down before then due to the inability to move in and out of the market efficiently, but that’s a problem I will happily face if I can grow my money to that scale. Also, the backtesting is end of day, while the reality is that I trade on mid-day data while the market is open.
The actual ETFs that I use are UPRO (+3), SPY (1), SH(-1), and SPXU(-3).
